The information being provided is strictly as a courtesy. When you link any of these websites provided herewith you are leaving this site. Our company makes no representation as to the completeness or accuracy of information provided at the sites. Nor is the company liable for any direct or indirect technical or system issues or any consequences arising out of your access to or your use of third-party technologies, sites, information and programs made available through the site. When you access one of these sites, you are leaving InFocus Financial Advisors’ website and assume total responsibility and risk for your use of the sites you are linking to.
SubmitWhat’s Up With the Consumer?

In our most recent investment committee meeting, we were discussing the importance and state of the U.S. consumer. It’s an important topic, and something we often pay attention to. Why? If you break down the components of U.S. economic growth, 70% comes from “consumption”. In plain terms, spending on various goods and services. Our ability to spend, and increase spending is of course largely based on a myriad of individual circumstances. However, when forecasting the business environment and climate, it’s important to see how consumers in aggregate fare today vs. history and what those spending patterns may look like in the near future.
One key metric is consumer debt to income ratios. You can think of this as the percentage of income a household puts towards debt payments. The higher this figure, the more debt consumers have, and the less ability they may have to increase spending moving forward. Looking at the data set from the Federal Reserve Bank of St. Louis, the latest reading from the 3rd quarter of 2021 was 9.21%. Going back to the earliest data we have in the dataset in 1980, that figure was 10.6%. And at the height of the housing boom in 2007, it was as high as 13%. So, on a relative basis, consumers seem to be keeping debt levels, and payments in check.
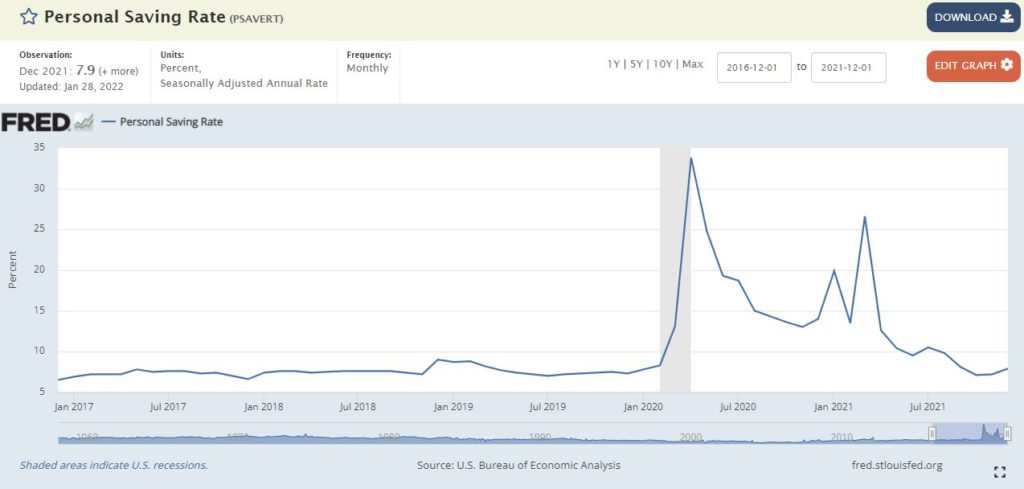
Another item we follow is personal savings rates. Another data point provided by the St. Louis Fed, this measures the amount of disposable income that gets saved. This is usually indicative of a healthy consumer, and when savings rates increase, it generally means that personal financial situations are improving through additional savings being built up. The latest reading in December of 2021 was 7.9%, which is slightly below its long-run average. This is coming down from nearly 20-25% during the earlier days of the pandemic in which there was substantial fiscal stimulus and direct stimulus checks to Americans. This is likely indicative that some of the excess savings built up over the pandemic is being spent and fueling some of the significant consumption at current.
In summary, looking at these datasets as a proxy for the state of the average consumer in the U.S. would leave you feeling optimistic. We’d agree. These numbers support a historically better-off consumer, and that may support further demand for goods and services across the U.S. economy in the near future.
The views are those of Robert Jeter, CFP®, CRPC and Eric Johnston, CFP® and should not be construed as specific investment advice. Investors cannot directly invest in indices. Past performance is not a guarantee of future results.
Investments in securities do not offer a fixed rate of return. Principal, yield and/or share price will fluctuate with changes in market conditions and, when sold or redeemed, you may receive more or less than originally invested. No system or financial planning strategy can guarantee future results.
Additional risks are associated with international investing, such as currency fluctuations, political and economic stability, and differences in accounting standards.
Investment Advisor Representative offering securities and advisory services offered through Cetera Advisors LLC, member FINRA/SIPC, a broker dealer and a Registered Investment Adviser. Cetera is under separate ownership from any other named entity.
